Foreword
I wrote this in 2016, with some revisions occurring later. In 2017, our ACA insurance rates went up by +56%. I wanted to understand why and undertook a major analysis of the ACA and what had transpired, why, and how it might be fixed.
Congress could have stepped in at any time and fixed these problems but chose not to. Much later, Congress enacted an expansion of the ACA subsidy program, which originally targeted only the lower income 50% of ACA participants, leaving half with no help. When Congress realized that ACA policies cost far more than the ACA’s own definition of affordability (premiums costing more than 8.5% of income), they extended a subsidy program to an estimated 80% of participants. They never fixed the underlying ACA problems that led to this situation.
As of 2024, the unsubsidized premium for a Bronze ACA policy for us (2 adults) is about $20,000 per year, with a $19,200 deductible. We are far from the most expensive – prices vary considerably by state and geographic area within states. This is not insurance – but catastrophic coverage. In fact, with the sky-high deductible, this is now much worse that catastrophic coverage policies previously.
ACA Individual Market is a de-facto “High Risk” Insurance Pool
Edward Mitchell, M.S., M.B.A.
June-September 2016
Summary
The ACA pushed newly insured higher risk patients (the pre-existing condition uninsured, who by definition, are higher risk) and all of the 35 pre-ACA state run “high risk” pool patients exclusively into the post-ACA individual risk pool.
As of 2017, none of this new risk is shared with other insurance market participants – this new risk is confined to the small individual insurance market. The ACA turned the individual market into a de-facto “high risk” and high cost insurance pool.
Literally, all of the new risks were pushed into the individual market and are paid for solely by the tiny individual market.
With only the individual market bearing these costs (as of 2017), premiums are skyrocketing. For 2017, average premiums will go up by +76% in Oklahoma, +60% in Minnesota and +59% in Tennessee as examples. Our own Oregon rate hike is +56%.
Fortunately, there are solutions that can be implemented by policy makers at either the State or Federal level. These solutions can equitably distribute risks to all market participants (as is now being done in Alaska) or enlarge the risk pools to distribute the risks to more people (Massachusetts, Vermont).
The Cause
The post-ACA “newly insured” in the individual market have greater health expenses (higher risks) than the pre-ACA non-group market due to the design of the ACA.
First, the high risk members of the pre-ACA 35 state run “high risk pools” were moved to the small individual market. The ACA redistributed these higher risks exclusively to the non-group market; none of this risk was redistributed to the large group, small group or Medicare markets.
Second, the post-ACA individual market added a large group of newly insured who had “pre-existing conditions” pre-ACA. By definition, this group had higher risk and higher costs.
All of this risk (cost) was placed into the post ACA individual market, turning the entire
nongroup market into a de facto “high risk” insurance pool, resulting in high premium costs, high deductibles, and limited coverage networks – and a poor economic value to much of the market.
In Iowa, a large insurer with a small risk pool is seeking a 2017 rate hike of +40% with 1/4th of that due to the costs of a single patient (Leys, 2016). In Montana, Blue Cross Blue Shield is seeking a +62% rate hike.
Rapidly increasing rates leads to market drop-outs, which leads to higher rates for a shrinking risk pool, leading to more drop-outs – the “death spiral” of the ACA.
Fairness and equity demand all stakeholders share these risks. It is arbitrary that 100% of the newly insured risks are burdened exclusively on the individual members of the small non-group market.
Background
Due to the structure of the ACA – the ACA sets the individual market as a single “risk pool”. “Health insurance issuers must treat all individual enrollees in their plans as a single pool and all enrollees in the small group market as another single pool” (Jost, 2010) and “The Affordable Care Act makes the most dramatic changes to the individual and small-group insurance market, aiming to create: a single health insurance pool in each state” (Baker, 2011).
We now know the newly insured have greater costs (higher risks) due to merging the prior “pre existing condition” uninsured and the state run “high risk pools” into a single non-group market place. Post-ACA, the individual market has exclusively absorbed all of this risk and cost as of 2017.
Insurers modeled the costs (or risks) of the individual market on the large group risks (Avalere Health, 2016) as they believed the individual market would be similar. But insurers discovered the demographics are different: “The HHS HCC risk adjustment model is developed from data on large employer self funded commercial claims. This database represents primarily large group market claims and encounter data, and does not reflect the demographic characteristics of the individual and small group commercial market” [emphasis added]. Avalere found the individual market post-ACA has higher risks, lower incomes, is older than the large group market and 30% of such enrollees remain in the market for less than one year. Part-year enrollees have 18% higher claims – and then drop out.
Blue Cross Blue Shield of North Carolina reported “One in five customers signed up for coverage, paid the first month’s premium, used services, and then dropped the plan” (Restrepro, 2015). The costs of these “part time” ACA freeloaders are born solely by the non-group market.
Wellmark notes utilization by those with pre-ACA grandfathered plans is less than the new ACA plans (Tibbitts, 2016), which is another way of saying the newly insured have higher risks and costs.
The ACA simply merged the risks of the newly insured “pre-existing condition” patients into the individual pool and pretended this would not be a problem by assuming vastly larger risk pools than actually developed post-ACA.
The individual market became a de facto high-risk pool whose prices discourage consumers from participating in the market. “When healthier individuals perceive no economic benefit to purchasing coverage, the insurance pool becomes increasingly skewed to those with higher expected claims” (American Academy of Actuaries, 2009).
To compensate for the additional risk forced into the individual market, insurers nearly nationwide are raising rates by double digit percentages, again. In Oregon, insurers are seeking a weighted average hike of 27%. The year before, they sought an average of 23% and the Oregon Insurance Commissioner approved an even higher 24.4% rate hike. As of September 2016, Providence Health has informed us of a rate hike of +56% for 2017; if we stay with them, our total costs to cover ourselves (“Silver”) and one adult daughter (in grad school) will come to $19,600 (including $1,200 for dental insurance).. This is not sustainable and leads directly to the “death spiral”. Indeed, we are contemplating dropping out of the market or moving to another state with a stable market.
These exorbitant prices are at odds with the objectives for the Affordable Care Act and the name of the Act itself.
Second, the majority of Oregon enrollees (60% in 2015) in the individual insurance market do not receive direct subsidies. Avalere (2016) reported that in 2014, only about one-third of the combined exchange and off exchange enrollees received subsidies. The Congressional Budget Office estimated that for 2016, just 45% of the non group market would receive subsidies (HHS/CMMS and the media use a sleight of hand to report that 70-85% receive subsidies, which is not true) (CBO, 2016).
According to CMMS, total Oregon exchange enrollment in 2015 was 113,219 (as of the end of the enrollment period) of which 75% received a subsidy, and 102,232 enrolled directly with unsubsidized, private insurance (did not use the exchange) for a total of 215,511 enrollees. (Numbers vary slightly depending on the date obtained and who released them.)
- 84,914 (75% of exchange enrollees) or 39.4% of individual market received subsidies
- 130,597 or 60.6% received no subsidies
CMMS claims the average 2016 premium rose by $49/person/month but in the subsidized market, the price rose by only $1/person/month because their risk was shifted to taxpayers. The 40% receiving subsidies are protected from the impacts of the rate hikes.
But exorbitant price hikes crush the segment that receives no subsidies. They are required to absorb 100% of the new “high risks” added to the individual market pool.
Third, the ACA included a new benefit for employer provided insurance enabling employees’ adult children to receive employer-sponsored insurance up to age 26. This removed a potential group of young, healthy enrollees from the individual market. (HHS estimates 3 million young people receive this benefit-Rep Suzanne Bonamici’s office says 6 million received this benefit – regardless, it shrunk the nongroup risk pool.)
Fourth, the ACA pools in most states are too small to distribute the risk. In Iowa, Wellmark Blue Cross Blue Shield is seeking a +40% rate hike for 2017 – because of the extreme costs of treating one patient (Leys, 2016). This illustrates the unsustainable concentration of risk into small risk pools.
Fifth, the ACA merged the state run “high risk” pools into the individual market, distorting the individual market risk pool. The pre-ACA “high risk” pools enrolled about 2% of the individual market in 2012 with an average cost per person of $32,108. But 4.4 percent of this group accounted for the majority of claims paid, averaging $225,000 per year (Norris, 2015). Let’s restate that – the majority of the high risk claims paid averaged $225,000/person/year and all of this risk – and cost – was thrust onto the individual payers and no one else.
Sixth, after millions of Americans received policy cancellations in 2013 contrary to the “If you like your health plan you can keep your health plan” sales pitch, the Administration issued rules permitting policy holders to retain pre-existing non-ACA policies through 2016. This took an additional group of insured out of the ACA markets, leading to smaller risk pools.
The individual market risk pools are too small and the risks too high. Each insurer maintains their own individual market risk pool, per state, and many of these pools are too small to remain viable. The Minnesota state Insurance Commissioner calls the ever rising rates “unsustainable and unfair”, noting “that people were being ‘crushed by the heavy burden of these costs.”’ (Doherty, 2016).
Risk Management
The large, small and Medicare groups take on no additional risk (as of 2017). Only the pre-existing individual market is forced into this high-risk pool. Because of the design of the ACA, the risk of the newly insured have not been distributed across enough people to moderate this risk.
In the first 3 years, the ACA included a “risk reinsurance” program that assessed a $63 per year fee on most insured, to redistribute the risks of the new individual nongroup market (Aon Hewitt, 2012, Federal Register, 2012, and IRS, 2016). This reinsurance program ends in 2016. The individual market risk pool is then left with its small group of high risk customers, without risk sharing with the large and small group markets. Consequently, rates are rising at high double digit levels. Rates rose at a faster rate in prior years, presumably because the $63 per person per year fee was inadequate to distribute the risks of the newly insured and the absorption of the 35 state run high risk insurance pool members.
The risks of new sign ups to Medicaid are on taxpayers. However, research indicates new Medicaid enrollees may have a lower risk profile (Decker, et al, 2016): “They also had lower levels of some risk factors and were in better health (Table 2). The uninsured adults were less likely to be obese and sedentary than [existing] Medicaid enrollees….. The uninsured adults reported better overall health and fewer functional limitations than Medicaid enrollees….” The ACA created a lopsided transfer of risk exclusively to the individual market risk pool.
This risk pool was worsened by the ACA’s failure to sign up the number of enrollees originally projected. Sign ups in the individual market are at about half the level of what the models projected in 2010 leaving the risk pools too small to be viable long term. The CBO projected 25 million exchange signups (only exchange signups, not including the non-exchange signups) by 2017 (Blumenthal and Collins, 2014); in 2016, exchange signups are half that.
Many insurers in Oregon have insufficient pool sizes to remain viable: “…insurers are unlikely to market through an exchange unless they can be assured of enough enrollees to offer a credible insurance risk pool. Small insurance pools, being potentially volatile and susceptible to destabilization by large claims, are problematic for insurers. According to one expert view, a risk pool of at least 100,000 covered lives would probably be necessary to be viable.” (Jost, 2010).
Compare Oregon’s small risk pool to California with a reported 1.6 million “exchange” enrollees in 2016 (Siepel, 2016) and a forecast for 2017 rate hikes of 8-9%. California has a risk pool at least 10 times greater than that of a small state such as Oregon, distributing risks over a larger group of people.
Various programs, such as “risk corridors” and industry subsidy programs are a mechanism to protect insurers – but not individual market customers – from this risk. The fundamental problem is the ACA’s internal risk transfer mechanisms retain all of the risk within the individual market risk pool – and transfer parts of it between insurance companies.
It Gets Worse
Starting in 2017, the risk profile of the individual market may worsen. In 2017, large employers (100+) will be permitted to move their employees to exchanges. If employers with high-risk workers do this (they have a financial incentive to do this) – and those with healthy or young workers do not (they have an incentive to not transfer) – the non-group market will take on more risk (Jost, 2010).
The “Cadillac Tax” was expected to encourage employers to end high benefit plans and consider moving their workers to individually purchased plans on the exchanges. This would increase the size of the risk pools, helping to distribute the new risks (Gruber, 2011). However, Congress deferred implementation of the “Cadillac Tax” to 2020 and many suspect Congress will defer this unpopular tax indefinitely. Thus, the expected increase in exchange enrollees from the Cadillac Tax will not happen.
The Impacts
The CBO originally estimated 20 million signups for 2016; current estimates are that we will end 2016 with about 10 million enrollees. Due to rate increases and ways to game the system and avoid penalties, we may have fewer enrollees in 2017 than in 2016.
Providence Health says about 1/5th of their 29.6% average requested rate hike is due to healthy members dropping out, creating a smaller pool of riskier members – also known as the “death spiral”.
ObamaCare policies are prohibitively expensive for those over middle age. The Department of Health and Human Services misleadingly quotes the “average” price for a 40 year old. While this sounds like an “average”, this value is deliberately and intentionally misleading – the rate for a 40 year old is almost the same as that for a 25 year old!
First, age 40 is not the midpoint of the age 21-64 group (43 is). Second, rates are nearly flat from age 21 through age 40; thereafter, rates take a very sharp turn upwards. This age rate multiplier chart illustrates the sharp price increases past age 40. (Age rate graph made from the age rate multiplier table in the 2015 Providence Health plan rate filing for Oregon, which is nearly identical to a CMMS produced forecast curve for the ACA.)
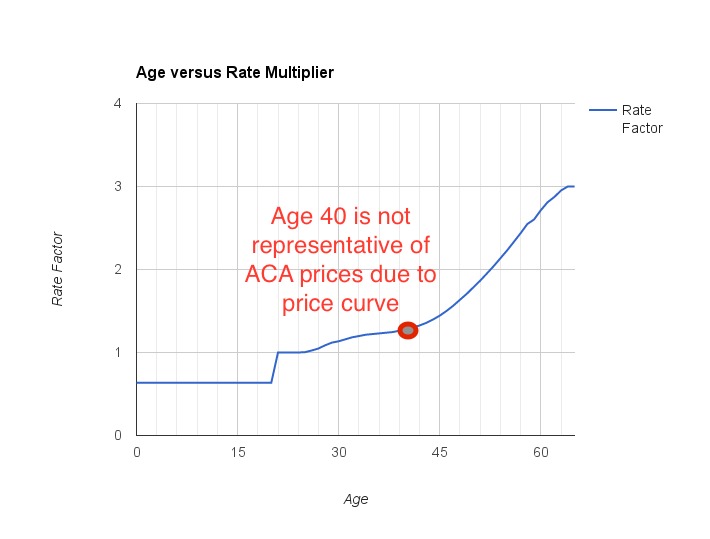
A honest price quote is at the midpoint of the price curve which occurs near age 50 and not the bottom of the price curve. The use of the “age 40” quote is intentionally misleading and should not be used. In 2015, the Oregon Insurance Commissioner’s office agreed with my assessment of this misleading “age 40” metric and began releasing quotes spanning the entire age range.
Solutions
There are potential solutions that must be considered by policy makers:
- Equitably redistribute the risks of the newly insured to all insurance participants, not just the individual market. This is the approach that the State of Alaska has taken (Summers, 2016) after all but one insurer dropped out of the market. Alaska is creating a single, statewide risk pool through a re-insurance program. Before Alaska did this, rates rose by 40% each of the past two years and were expected to rise by +60% for 2017. After fixing the risk pool problem, the rate hike for 2017 came in at 9.8% (Hale, 2016).
- Reintroduce the expiring reinsurance program, with revised fees per insured that are reflective of the actual market risks now identified in the nongroup market.
- Allow insurers to combine their individual and small group risk pools; this is permitted by the ACA and is being done in Massachusetts and Vermont (Arron, Lucia, and Giovannelli, 2016).
- Consider allowing insurers to merge risk pools across state lines to enlarge their risk pools.
- Some advocate restoring taxpayer funded “high risk pools”, paid for by all insurance stakeholders. This would distribute costs to all taxpayers – but is likely less effective than providing a re-insurance program.
- Permit individual market participants to buy the “risk management” insurance they need, rather than expansive insurance for risks they cannot have-I cannot get pregnant but the ACA requires that men purchase maternity insurance for themselves. Provide a broader range of policies that are matched to purchaser tolerance for risk. We do this now with the concept of Bronze through Platinum, but this provides an inadequate set of risk choices to match bona fide consumer needs.
- Enlarge the risk pools by moving more lives into the individual markets. Hypothetically, moving all 22 million local, state and federal workers to the exchanges would quickly enlarge the risk pools.
- Adopt a “single payer” scheme that uses one nationwide risk pool or even state-wide risk pools that encompass all market participants.
- While a “public option” is of interest, it may not solve this root cause problem. Indeed, in a market that has “N” insurers, the public option suggests we might have “N+1” insurers. Since each insurer maintains their own individual market risk pool, this implies each pool becomes smaller, distributing the risks over fewer people. (In reality, though, if a public option is as cost effective as proponents claim, it would drive other insurers out of the market and the 55% of counties with only 1 or 2 insurers in 2017, may end up with a “public option” acting as the only single payer in town.)
- According to the CBO (CBO, 2016), the majority of the nongroup ACA market do not receive subsidies yet government officials at CMMS, HHS and in some states, repeatedly claim that a majority of consumers are subsidized. Outright lies lead us away from informed, constructive dialogue leading to solutions.
Gaming The System
As prices rise substantially, more and more individuals will “game the system” and drop out of the ACA.
Several strategies to game the system include:
- As rates quickly rose, individual consumers discovered they are exempt from the “Shared Responsibility Penalty” tax. If the lowest cost Bronze plan costs more than 8.05% of one’s income, then the consumer is exempt from paying a penalty for not having ACA compliant insurance (IRS Form 8965). Let us put this in actual numbers – for 2017, a married couple in their late 50s may find (in Oregon) that the lowest cost Bronze plan for two is $750/month or $9000/year. $9000 is 8.05% of a nearly $112,000 income (actual numbers will vary depending on calculation of the MAGI value).
- Effectively, older couples are exempt from the mandate penalty. Such couples may choose to buy less expensive, non-ACA compliant “short term insurance”. Short term policies exclude “pre-existing conditions” and are similar to pre-ACA policies in coverage and cost. While the White House rudely refers to such policies as “junk policies”, these policies are equivalent to the typical employer provided insurance offered for decades.
- For those with investment income, put all investments into non-income producing (capital gain only) investments. Set aside living expenses for several years in savings accounts. With one’s income now below the cut off for subsidies, live off the savings and let the government pay for health expenses. Withdrawals from savings are not income.
- Transfer all investments, including income-producing investments, into independent trusts (Mangan, 2016). Assign your adult children (or a third party) as trustee(s) for the trust. Have the trust pay you an income less than the subsidy cut off level and let the government pay for your health expenses. This can be combined with the savings account concept in (3). At age 65, have yourself restored as a trustee of the trust and regain control of the assets.
- For older workers nearing retirement, income transferred into retirement accounts is subtracted from the MAGI. For workers over 50, up to $24,000 per year per worker may be contributed to an employer sponsored 401(k) program, thereby lowering income by the same amount. For a typical couple, this can result in annual government health subsidies of $5,000 or more. A $5000 return on $24,000 in a 401(k) plan is a fantastic return on investment.
- Consider enrolling in a religion-based health sharing network, which is exempt from the ACA mandates.
- As the rates rise, more consumers may be eligible for Federal subsidies, thereby moving risk from insurers and consumers to the Federal taxpayer.
- Insurer Centene is, in 2017, offering a lower priced Silver plan with deductible set to $7,050/person. This may have the effect of discouraging “unhealthy” sign ups into their risk pool, thereby gaming the system for their benefit. This plan will be priced significantly lower than other Silver plans. Since the Silver plan is the benchmark for subsidies, this lowers subsidy dollar values by up to 20% in the markets where offered. A reduction in subsidy levels may discourage subsidized consumers from signing up for ACA coverage.
- Many states are approving a $15 per hour minimum wage. A 40 hour work week at $15/hour will, for many workers, exceed the Medicaid eligibility income level – therefore, states have an incentive to raise the minimum wage to a level that pushes Medicaid recipients off of state funded Medicaid and on to Federal-taxpayer subsidized exchanges. This offloads state expenses on to both the Federal taxpayer and to consumers who pay more for certain goods and services.
Conclusion
The non-group market is unfairly absorbing all of the new risks in the health insurance marketplace.
By definition and ACA design, the post-ACA newly insured have higher risks (costs) than the pre-ACA non-group market.
35 pre-ACA state-run “high risk insurance pools” have moved all of their members solely into the individual non-group market.
About 20% of the newly insured are signing up, using health services, and then dropping out, adding to costs for everyone else.
100% of these new risks are borne exclusively by the non-group market, as of 2017, and are not shared with any other insurance group.
The design of the ACA turned the individual market into a “high risk” pool, which is directly opposed to making insurance affordable, as implied in the Act’s title.
Most of the individual insurance risk pools (which are by insurer, by state) are too small to equitably spread the risk.
A solution is to immediately expand the individual market risk pools by combining risk pools “in state” (as in Alaska and as permitted by the ACA), by permitting insurers to merge risk pools across state lines, by merging individual and small group markets (as in Massachusetts and Vermont), by restoring a reformulated “risk insurance” program, and/or moving government workers to the exchanges to immediately increase the size of the risk pools.
Exorbitantly high prices are forcing healthy and near healthy of all ages out of the market. With opportunities to “game the system”, more and more of the healthy will leave the ACA marketplace as insurance remains unaffordable with rapidly rising prices.
This leads to the “death spiral” reported by Providence Health and one of the “Blues”: the ACA is not sustainable in its present form as evidenced by major market dropouts by UnitedHealth, Aetna and Humana, as well as the abandonment of many counties in Oregon by local insurers.
Policy makers must undertake urgent actions to save the ACA from dying as rates become prohibitive and people leave the market by gaming the system.
What are policy makers doing to fix this crisis? Four years into the ACA program and there is a startling lack of leadership on this issue; the politicians who promoted the ACA have gone “radio silent” with nothing to say.
With no end in sight to year after year of double digit price hikes, consumers are scared, frightened and angry with political leaders who are not working to fix obvious defects – which are even fixable!
The ACA’s nongroup market is, in an engineering sense, an “out of control system”, where the price hikes, each year are consistently greater than the year before, with no end in sight. If nothing is done urgently, the ACA will collapse.
References
Aon Hewitt. (2012). HHS Proposes $63 Transitional Reinsurance Fee for Group Health Plans in 2014. Retrieved from: http://www.aon.com/attachments/human-capital-consulting/US_2012_HHS_Proposes_Transitional_Reinsurance_Fee.pdf
Actuaries. (2009). Critical Issues in Health Reform: Risk pooling. American Academy of Actuaries. July 2009. Retrieved from: http://www.actuary.org/pdf/health/pool_july09.pdf
Arron, H., Lucia, K, and Giovannelli, J. (2016) The next stage of ObamaCare reform. Real Clear Markets. Retrieved from: http://www.realclearmarkets.com/articles/2016/05/24/the_next_stage_of_obamacare_reform_102183.html
Avelere Health. (2016). Evolving the risk adjustment model to improve payment accuracy in the individual and small group market. Retrieved from: http://go.avalere.com/acton/attachment/12909/f-02b6/1/-/-/-/-/20160324_Avalere%20Evolving%20Risk%20Adjustment%20Model_FINAL.pdf
Baker, Tom, (2011). Health Insurance, Risk, and Responsibility after the Patient Protection and Affordable Care Ac”. University of Pennsylvania Law Review. Vol. 159, No. 6, June 2011. Retrieved from: https://www.monroecollege.edu/uploadedFiles/_Site_Assets/PDF/viewcontent.pdf
Blumenthal, D., and Collins, S. R. (2014). Health Care Coverage under the Affordable Care Act — A Progress Report. N Engl J Med 2014; 371:275-281 July 17, 2014 DOI: 10.1056/NEJMhpr1405667. Retrieved from: http://www.nejm.org/doi/full/10.1056/NEJMhpr1405667
Congressional Budget Office (CBO). (2016). “Federal Subsidies for Health Insurance Coverage for People Under Age 65: Tables From CBO’s March 2016 Baseline”. Retrieved from: https://www.cbo.gov/sites/default/files/51298-2016-03-HealthInsurance.pdf
Decker, S., Kostova, D., Kenney, G., Long, S. (2013). Health status, risk factors, and medical conditions among persons enrolled in Medicaid vs uninsured low-income adults potentially eligible for Medicaid under the Affordable Care Act. JAMA. 2013 Jun 26;309(24):2579-86. doi: 10.1001/jama.2013.7106. Retrieved from: http://jama.jamanetwork.com/article.aspx?articleid=1699906
Doherty, K., (2016). Near ‘Collapse’, Minnesota to raise Obamacare rates by half. Bloomberg. Sep 30 2016. Retrieved from: http://www.bloomberg.com/news/articles/2016-09-30/near-collapse-minnesota-insurers-up-obamacare-rates-by-half
Gruber, J. (2011). The impacts of the Affordable Care Act: How reasonable are the assumptions?. National Bureau of Economic Research. Retrieved from http://economics.mit.edu/files/6829 and from http://www.nber.org/papers/w17168
Federal Register. (2012). Department of Health and Human Services. 45 CFR Parts 153, 155, 156, 157 and 158 Proposed Rules. Retrieved from: https://www.gpo.gov/fdsys/pkg/FR-2012-12-07/pdf/2012-29184.pdf
Hale, Z. (2016). “Premera requests 9.8% rate increase for individual plans in Alaska”, State of Reform. Retrieved from: http://stateofreform.com/featured/2016/07/premera-requests-9-8-rate-increase-individual-plans-alaska/
IRS. (2015). 2015 Instructions for Form 8965. Internal Revenue Service. Department of the Treasury. Retrieved from: https://www.irs.gov/pub/irs-pdf/i8965.pdf
IRS. (2016). ACA Section 1341 transitional reinsurance program FAQs. Department of the Treasury. Retrieved from: https://www.irs.gov/uac/newsroom/aca-section-1341-transitional-reinsurance-program-faqs
Jost, T.S. (2010). Health Insurance Exchanges And the Affordable Care Act: Key Policy Issues. The Commonwealth Fund. July 2010.
Leys, T. (2016). Wellmark plans 38% to 43% increases for some customers. Des Moines Register. Retrieved from: http://www.desmoinesregister.com/story/news/health/2016/05/12/wellmark-plans-38-to-43-increases-some-customers/84277758/
Mangan, D. (2016). They’re millionaires, and they get ObamaCare subsidies. CNBC. Retrieved from: http://www.cnbc.com/2016/01/27/theyre-millionaires-and-they-get-obamacare-subsidies.html
NCSL. (2014). Coverage of Uninsurable pre-existing conditions: State and Federal High-risk Pools. National Conference of State Legislatures. Retrieved from: http://www.ncsl.org/research/health/high-risk-pools-for-health-coverage.aspx
Norris, L. (2015). Health insurance and high-risk pools. HealthInsurance.org. Retrieved from:
Restrepo, K. (2015). Obamacare enrollment shows evidence of ‘adverse selection’. John Locke Foundation. Retrieved from: http://www.johnlocke.org/press_releases/show/774
Siepel, T. (2016). Obamacare: Are Covered California’s numbers plateauing?. Retrieved from:
Summers, D. (2016). Premera gets more time to file rates as fix awaits special session. Alaska Journal of Commerce. May 11, 2016. Retrieved from: http://www.alaskajournal.com/2016-05-11/premera-gets-more-time-file-rates-fix-awaits-special-session#.VzaZsRUrIlU
Tibbitts, E. (2016). Wellmark proposes big rate hikes for ACA plans. Sioux City Journal. Retrieved from: http://siouxcityjournal.com/news/state-and-regional/iowa/wellmark-proposes-big-rate-hikes-for-aca-plans/article_026a7de5-634b-5177-a28f-5caa06471726.html
Revision History
Revision A – first draft release
Revision B – added comments from Avalere Health, comments about Centene, and comments about Wellmark, in Iowa.
Revision C – added comments from Sioux City Journal about Wellmark plans and corrected Revision B edit about Wellmark.
Revision D – Moved the “Solutions” section to later in the document. Minor editing changes based on feedback.
Revision E – added comments on risk of new Medicaid insured.
Revision F – added citation to CNBC article on how to get subsidies.
Revision G – added chart of the CMMS genuine age rate multiplier curve.
Revision H – added combining individual and small group markets, added information on the actual costs of the pre-ACA “high risk” pools.
Revision I – added note about the risk reinsurance program that ends in 2016; this did collect a fee from all insured to level risks. With its ending in 2016, all risks are now born solely by the individual market risk pool.
Revision J – added CBO (2016) reference to confirm that the majority of ACA nongroup market does not receive any subsidies, contrary to mis-statements by HHS/CMMS.
Revision K – added to suggested solutions to stop claiming the majority receive subsidies
Revision L – August 2016-minor edits, added information on Alaska
Revision M – September 2016-added “Sixth” note that permitting pre-ACA policies to continue post-ACA, after policy cancellations, leads to smaller risk pools.
Revision N – October 2016, general edits to improve readability